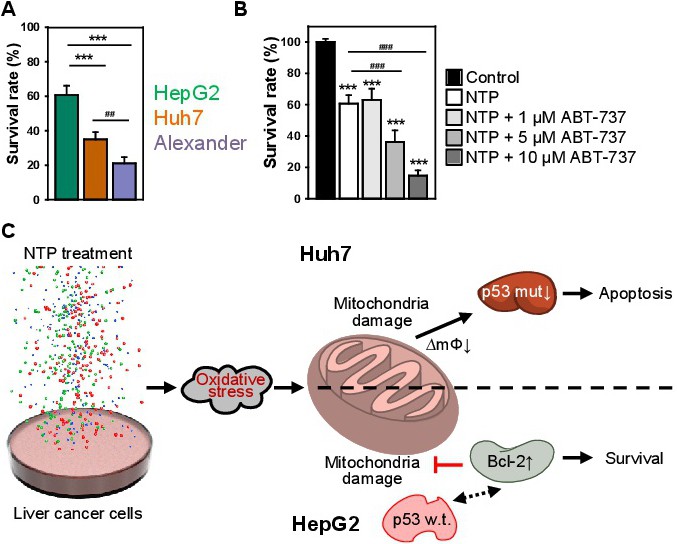
Fig. 11. Inhibition of Bcl-2 sensitises resistant HepG2 to NTP induced cell death. (A) Comparison of survival rate between Huh7, HepG2 and Alexander cell lines 24 h post plasma treatment. Cells were treated with NTP for 60 s and cell viability was analysed by WST-1 assay. The data were normalized to control values (no exposure), which were set as 100 % cell viability. Readings were done in quadruplicates, data are present as mean ± SEM, n=3 (three independent experiments). One-way ANOVA with Newman-Keuls multiple comparison test was used; ##P< 0.01, ***P< 0.001. (B) Bcl-2 inhibition restores NTP sensitivity in resistant HepG2 cells. Cell viability as detected by the WST-1 assay of HepG2 treated with NTPs for 60 s with supplementation of 1, 5 or 10 µM ABT-737 (selective Bcl-2 inhibitor), measured 24 h after exposure. Readings were done in quadruplicates, data are present as mean ± SEM, n=3 (three independent experiments). One-way ANOVA with Newman-Keuls multiple comparison test was used; ###P< 0.001, ***P< 0.001. (C) Tentative scheme of molecular mechanisms of Huh7 sensitivity and HepG2 resistivity to NTP induced cell death. ΔmΦ - mitochondrial membrane potential.